
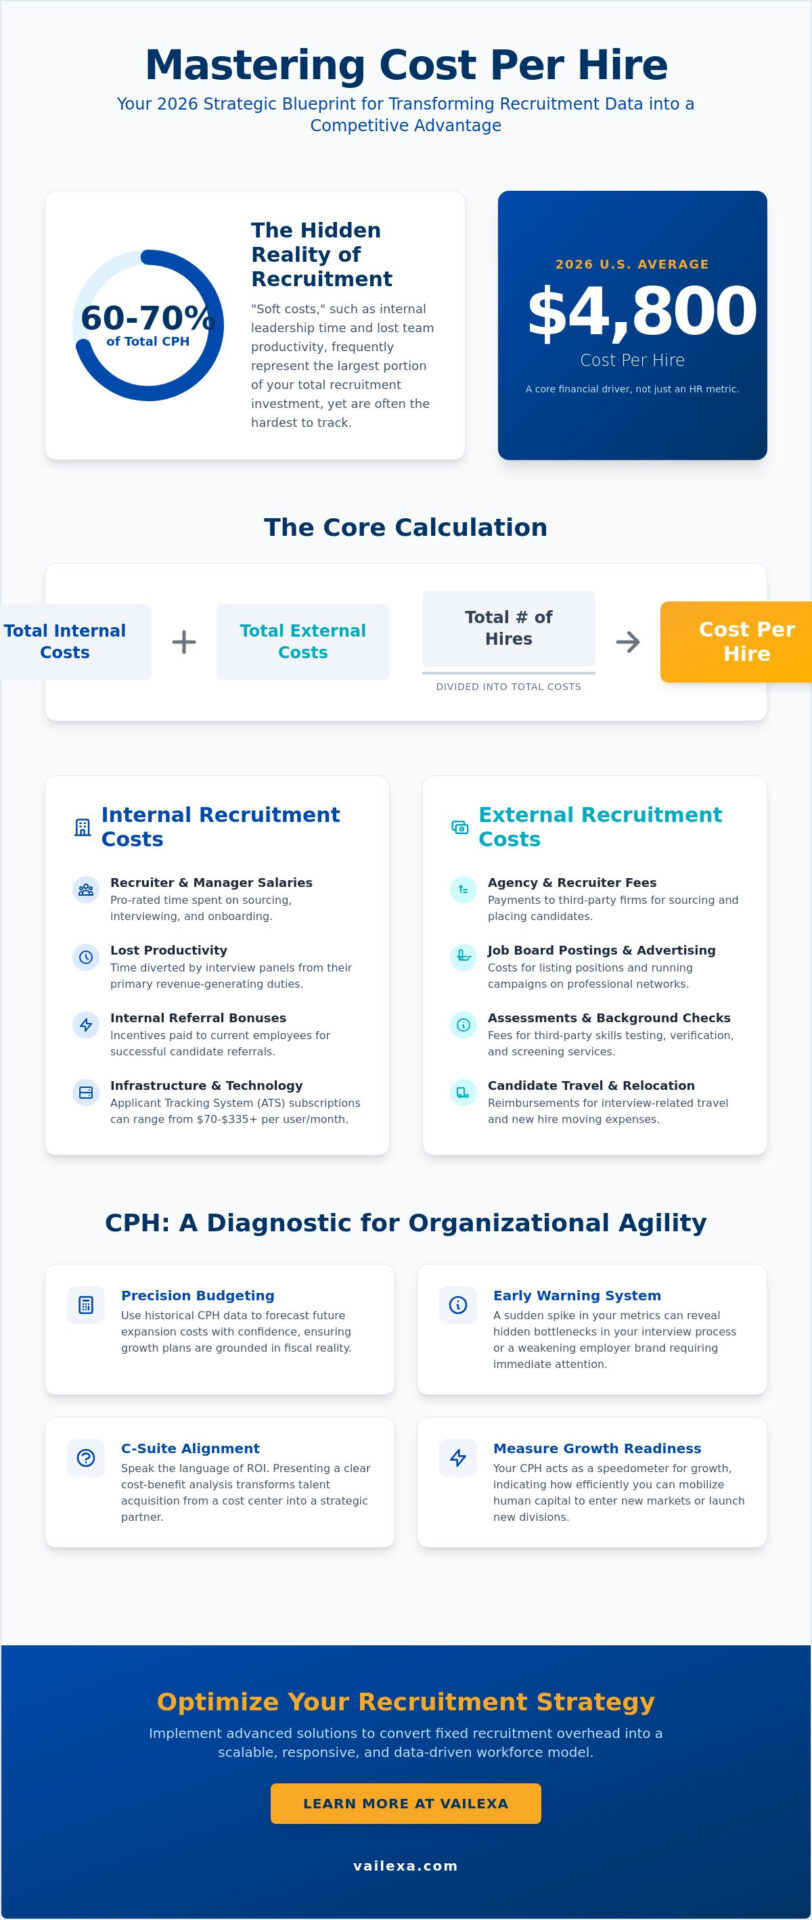
Soft costs, such as internal leadership time and lost productivity, account for 60% to 70% of your total recruitment investment. While the average cost per hire in the U.S. has climbed to approximately $4,800 in 2026, many organizations still struggle to capture the full scope of their spending. You likely recognize the difficulty of aligning inconsistent data across departments or justifying talent acquisition costs to a skeptical C-suite. Understanding how to calculate cost per hire isn’t just about balancing a ledger; it’s about establishing a diagnostic lens for your organizational agility.
You deserve a recruitment strategy that reflects your commitment to excellence and high standards. This blueprint will help you master the precise methodology required to transform raw data into a strategic asset for growth. We’ll provide a repeatable calculation process, share current industry benchmarks for 2026, and explore sophisticated strategies to optimize your spend while maintaining a sharp focus on talent density and quality.
Key Takeaways
- Shift your perspective on recruitment investment by viewing cost per hire as a vital indicator of organizational agility and long-term talent density.
- Master the precise methodology for how to calculate cost per hire by integrating internal infrastructure costs with external agency and marketing expenditures.
- Establish a rigorous audit rhythm that replaces annual reviews with quarterly data cycles to ensure your recruitment spend remains aligned with C-suite expectations.
- Uncover the hidden financial drain of slow hiring cycles and learn to benchmark your performance against specific 2026 industry standards.
- Implement advanced optimization strategies, including RPO and AI staffing solutions, to convert fixed recruitment overhead into a scalable and responsive workforce model.
Defining Cost Per Hire: More Than Just a Recruitment Metric
Cost per hire represents the total economic investment required to secure a single new employee. It functions as a fundamental pillar within the broader scope of Recruitment metrics, providing a clear window into the financial health of your talent acquisition engine. In 2026, the average cost per hire in the U.S. has stabilized between $4,700 and $4,800. This figure suggests that talent acquisition is no longer a peripheral HR function; it’s a core financial driver. Leaders who understand how to calculate cost per hire with precision can move beyond reactive spending toward a model of data-driven talent acquisition that anticipates market shifts.
There is a critical distinction between the “cost of hire” and the “value of hire” that high-growth organizations must recognize. While cost focuses on the immediate expenditure of resources, value considers the long-term contribution and talent density of the individual. Using cost per hire as a primary KPI allows you to evaluate recruitment process efficiency with surgical accuracy. It highlights whether your current investments are yielding the high-caliber professionals necessary to sustain a competitive advantage in a “low-hire, low-fire” labor market.
The Strategic Importance of Tracking CPH
Precision in budgeting requires more than just guesswork. By using historical data, you can forecast future expansion costs with confidence, ensuring that your growth plans are grounded in fiscal reality. A sudden spike in your metrics often serves as an early warning system; it might reveal hidden bottlenecks in your interview process or a weakening employer brand that requires immediate attention. When you speak the language of ROI, you bridge the gap between HR and the C-suite. Presenting a clear cost-benefit analysis transforms talent acquisition from a cost center into a strategic partner that Finance can support and fund.
CPH as a Diagnostic for Organisational Agility
Agility is measured by how quickly you can pivot into new markets or launch specialized departments. Your recruitment metrics act as a speedometer for this growth, indicating how efficiently you can mobilize human capital. This efficiency is particularly visible when evaluating the impact of your Global Talent Solutions, where localized costs and international talent pools create complex financial variables. Cost per hire serves as a definitive diagnostic tool for measuring the talent density and operational readiness of your workforce. By refining these numbers, you ensure that your organization remains lean, responsive, and prepared for the next phase of excellence.
The Cost Per Hire Formula: Categorizing Internal and External Expenses
Precision in financial reporting requires a disciplined approach to data categorization. The standard industry formula is mathematically straightforward: sum your internal and external recruiting costs, then divide that total by the number of hires within a specific period. While the equation is simple, the accuracy of your strategic insights depends entirely on the integrity of your inputs. Learning how to calculate cost per hire effectively means you must look beyond surface-level invoices to capture the full economic weight of your talent acquisition efforts.
The math is simple. The inputs are not. To achieve a comprehensive view, you must distinguish between the visible expenses paid to third parties and the often overlooked operational costs incurred within your own walls. This clarity allows you to justify recruitment spend to the C-suite with confidence and poise.
Deep Dive: Internal Recruitment Costs
Internal costs are frequently underestimated because they involve “soft” expenditures that don’t always appear as a single line item. These include the pro-rated salaries of your talent acquisition team and, crucially, the time diverted from hiring managers and interview panels. Current 2026 data indicates that these soft costs, including lost productivity, can account for 60% to 70% of the total cost of hiring. You must also account for internal referral bonuses and the fixed costs of your infrastructure. For instance, an Applicant Tracking System (ATS) can range from $70 to over $335 per user per month, depending on whether you utilize entry-level or enterprise-grade solutions.
Deep Dive: External Recruitment Costs
External costs represent the capital leaving your organization to attract and secure talent. This category includes third-party agency fees for contingent staffing, which typically average between 20% and 25% of a new hire’s first-year salary. For executive-level searches, retained fees often reach 35%. Digital recruitment marketing is another significant variable; monthly campaign costs can range from $1,000 to $20,000 depending on your scale. These investments cover specialized job board subscriptions, LinkedIn Recruiter licenses, and the sophisticated branding collateral required to maintain a high-level employer presence.
Don’t ignore the granular variables that erode your budget. Background checks, candidate travel, and specialized technology stacks for AI talent mapping often go unrecorded. Failing to account for these variables masks the real cost of bad hiring decisions. By categorizing these expenses with surgical precision, you gain the foresight needed to optimize your workforce. For organizations managing high-volume or complex pipelines, Talent Mapping provides the strategic data required to lower these external expenditures without sacrificing quality.
Step-by-Step: How to Calculate Cost Per Hire for Your Organisation
Implementing a rigorous calculation process transforms recruitment from a guessing game into a precise science. To master how to calculate cost per hire, you must first establish a measurement period that reflects the speed of your business. While annual reviews were once the standard, the volatility of the 2026 labor market demands quarterly audits. These shorter cycles allow you to pivot strategies in real time rather than waiting twelve months to discover a budget leak.
Accuracy relies on the seamless integration of finance reports with your ATS recruitment metrics. You must validate your hire count by ensuring the denominator only includes external acquisitions. Internal transfers represent mobility and talent development; excluding them prevents your data from being artificially diluted. This disciplined approach ensures that your final figure is a true reflection of new talent acquisition costs.
Step 1: Audit Your Talent Acquisition Spend
Creating a centralized ledger for all recruitment-related invoices is the first step toward total visibility. This ledger should distinguish between one-off costs, such as employer branding collateral, and recurring technology subscriptions like your ATS or sourcing tools. You must also account for the pro-rated time of multi-functional interview teams. Tracking these hours provides a more honest reflection of your total investment than looking at agency fees alone. It’s this level of detail that reassures corporate decision-makers of your fiscal responsibility.
Step 2: Apply the Formula and Segment by Role
Once you apply the Cost per Hire formula, you must segment the results to find actionable insights. A blended average often masks critical inefficiencies. For example, the cost to hire an executive in 2026 typically exceeds $28,000, while entry-level roles remain significantly lower. Understanding how to calculate cost per hire for a specialized executive search process requires a different set of variables than a high-volume campaign.
Analyzing Your Results: Benchmarks and Hidden Recruitment Costs
Benchmarking your results provides the necessary context to determine if your recruitment engine is operating at peak performance. A raw number, isolated from industry standards, offers little strategic value. In 2026, the benchmarks for excellence have shifted. Technology organizations now face an average cost of $6,200 per hire, while the Finance sector averages $5,900. Healthcare remains closer to the national average at $4,700. If your figures deviate significantly from these marks, it’s time to investigate your “cost leaks,” particularly within the sourcing and screening stages where inefficient manual outreach often inflates the budget.
The hidden cost of vacancy is a silent revenue killer that many leaders fail to quantify. Every day a critical role remains unfilled, your organization loses the productivity and innovation that individual would have contributed. This drain on resources is why mastering how to calculate cost per hire must include a diagnostic look at your time-to-fill. Slow optimization doesn’t just increase your hiring spend; it actively erodes your competitive edge by leaving key seats empty during pivotal market shifts.
The Quality of Hire Paradox
There is a dangerous temptation to view a declining CPH as an absolute victory. However, the cheapest hire often becomes the most expensive turnover. If your selection process is too lean, you risk sacrificing the rigorous vetting required to ensure high-level talent density. A low CPH often indicates a dangerous lack of talent density, suggesting that the organization is prioritizing administrative speed over the long-term strategic alignment of its workforce. Measuring the 12-month ROI of a new hire against their initial acquisition cost often reveals that a higher upfront investment in quality yields a far superior return.
Hidden Costs: The Price of a Bad Hire
A bad hire’s true price extends far beyond their salary. You must factor in the cost of re-recruitment, the lost productivity of the departing individual, and the potential disruption to team morale. Cultural misalignment can trigger a ripple effect that lowers performance across an entire department. Many visionary organizations now utilize diversity and inclusion consulting to build more resilient, aligned teams that boast higher retention rates. By investing in these foundational elements, you lower your long-term CPH and stabilize your talent pipeline. To ensure your recruitment spend is driving actual business results, consult with our experts in Strategic Workforce Planning today.
Strategic Optimization: Reducing CPH Through RPO and Agile Models
Mastering the methodology of how to calculate cost per hire provides the clarity needed to identify financial leaks, but the true mark of a strategic leader is the ability to optimize those expenditures. In 2026, visionary organizations are moving away from rigid, legacy hiring models toward agile frameworks that emphasize scalability and speed. Leveraging Recruitment Process Outsourcing (RPO) allows you to convert heavy fixed costs into manageable variable costs, scaling your talent acquisition efforts in direct response to market demand. This transition ensures that your budget remains lean during periods of stability while providing the necessary horsepower for rapid expansion when a competitive window opens.
Technology functions as a critical force multiplier in this evolution. With 62% of employers expected to operationalize AI in their hiring processes by 2026, AI Staffing Solutions are no longer a luxury for the few. These sophisticated tools accelerate sourcing and screening, which significantly reduces the manual internal hours that often inflate your total investment. By automating repetitive administrative tasks, your talent acquisition team can focus on high-value candidate engagement and cultural alignment. This human-centric approach, supported by data-driven precision, ensures that your recruitment process is both efficient and deeply persuasive to top-tier talent.
The RPO Advantage: Efficiency at Scale
RPO providers offer a unique advantage by leveraging economies of scale that internal departments can’t always replicate. They lower external sourcing costs through consolidated job board partnerships and proprietary talent mapping technologies. This centralized expertise reduces your time-to-fill, which directly minimizes the “Cost of Vacancy” that drains organizational productivity. By standardizing recruitment metrics across your entire global footprint, RPO models provide a unified and transparent view of your total spend. This level of oversight is essential for maintaining high standards and justifying talent investments to the C-suite with composure and confidence.
Building a Sustainable Talent Pipeline
Sustainability in recruitment requires a fundamental shift from reactive sourcing to proactive Talent Mapping. Instead of engaging in expensive “panic” hiring when a vacancy arises, predictive workforce planning allows you to identify and nurture talent pools long before a seat becomes empty. This foresight stabilizes your pipeline and reduces the need for high-cost, emergency interventions. Additionally, you must prioritize the candidate experience to protect your ROI. With mobile devices accounting for 71% of job clicks in 2026, a frictionless, mobile-first application process is vital to prevent candidate drop-off. A swift and transparent experience improves offer acceptance rates, ensuring that your initial investment in how to calculate cost per hire results in a successful, long-term placement.
Optimize your recruitment ROI with Vailexa’s strategic workforce solutions.
Empowering Your Strategic Talent Evolution
Recruitment in 2026 demands a departure from anecdotal decision-making in favor of rigorous, data-driven precision. By mastering how to calculate cost per hire, you gain more than a budget metric; you secure a diagnostic tool that reveals the true health of your organizational growth. The transition from reactive spending to proactive workforce planning requires a disciplined integration of internal infrastructure costs and external market variables. This clarity allows you to justify spend while ensuring your talent density remains high.
Achieving this level of excellence requires a partner that understands the complexities of the global labor market. Vailexa offers a global footprint in AI and Data Analytics staffing, providing the sophisticated insights needed to optimize your recruitment ROI. From Recruitment Process Outsourcing (RPO) to strategic workforce planning and integrated D&I consulting, our solutions are designed for organizations that don’t settle for the status quo. It’s time to move beyond simple spreadsheets toward a future of predictive talent acquisition.
Partner with Vailexa for Data-Driven Talent Solutions and turn your recruitment data into a powerful engine for long-term stability. Your journey toward a more agile, high-performing workforce begins with a commitment to precision and excellence.
Frequently Asked Questions
Does cost per hire include the salary of the new employee?
No, cost per hire doesn’t include the base salary or compensation package of the new employee. It focuses exclusively on the capital and operational resources expended to identify, attract, and secure a candidate. While total employee cost includes salary and benefits, CPH is a specialized metric designed to evaluate the efficiency of your talent acquisition process.
How often should a company calculate its cost per hire?
Organizations should calculate their cost per hire on a quarterly basis to maintain agility in the 2026 labor market. While annual reviews provide a historical perspective, quarterly audits allow you to identify budget leaks and optimize sourcing strategies in real time. This frequency ensures that your recruitment data remains a relevant and actionable asset for the C-suite.
What is the average cost per hire for executive-level positions in 2026?
The average cost to secure an executive in 2026 is approximately $28,000 or more. This elevated figure reflects the complexity of executive search, which often involves retained agency fees, sophisticated talent mapping, and extensive interview loops. These high-stakes hires require a more significant investment in precision and vetting to ensure long-term organizational stability and leadership quality.
Can recruitment process outsourcing (RPO) actually lower my CPH?
Yes, a strategic RPO model can significantly lower your investment by converting fixed internal overhead into a scalable variable cost. RPO providers leverage economies of scale and advanced AI staffing solutions to reduce external sourcing expenses. This approach streamlines your talent pipeline and minimizes the cost of vacancy through faster, more efficient hiring cycles that protect your bottom line.
What is the difference between cost per hire and cost per source?
Cost per hire is an aggregate metric representing the average spend for all successful acquisitions, while cost per source isolates the investment for a specific channel. Understanding how to calculate cost per hire for individual platforms like LinkedIn or niche job boards allows you to reallocate budget toward the highest-performing streams. This granular visibility prevents wasteful spending on underperforming talent pools.
How do I account for the time hiring managers spend interviewing?
You account for hiring manager time by calculating the pro-rated hourly rate of each participant based on their annual salary. Multiply this rate by the total hours spent in interviews and feedback sessions to capture the true internal cost. Neglecting this variable is a common oversight that leads to an artificial underestimation of your total recruitment investment and misaligned financial reporting.
Should onboarding costs be included in the cost per hire calculation?
Onboarding costs are typically excluded from the standard cost per hire calculation because they pertain to employee integration rather than acquisition. Most organizations stop the CPH clock once the candidate accepts the offer and begins their first day. Including training and orientation expenses would shift the metric toward a cost of productivity rather than a pure recruitment efficiency KPI.
What are the most common mistakes when using the cost per hire formula?
The most frequent errors include including internal transfers in the hire count and failing to track the hidden costs of internal leadership time. These mistakes dilute the accuracy of your results and make it difficult to justify recruitment spend to financial stakeholders. Learning how to calculate cost per hire correctly requires a disciplined focus on external acquisitions and comprehensive, multi-departmental data aggregation.